Getting Started with the Smart Note Visualizer

Purpose / Objective
Want to see your notes from a bird’s-eye view? The Smart Note Visualizer provides an intuitive graph-based representation, letting you quickly discover connections across your vault.
User Goal
Install and enable the plugin in minutes, then verify that your vault’s notes appear in a visual, interactive graph.
Logline
Get from zero to a fully interactive graph in no time. Seamlessly explore and open notes by clicking on their nodes, all without leaving Obsidian.
Real-World Use Case
Suppose you’re juggling multiple projects or research topics. Instead of searching file by file, the Smart Note Visualizer surfaces your entire vault in one interactive view, making it easier to spot overlaps and big-picture structures.
Workflows
Demo 1: Installing and Verifying the Visualizer
Step 1: Open a Fresh Vault
Open or create an Obsidian vault where you’d like to install the Smart Note Visualizer plugin.
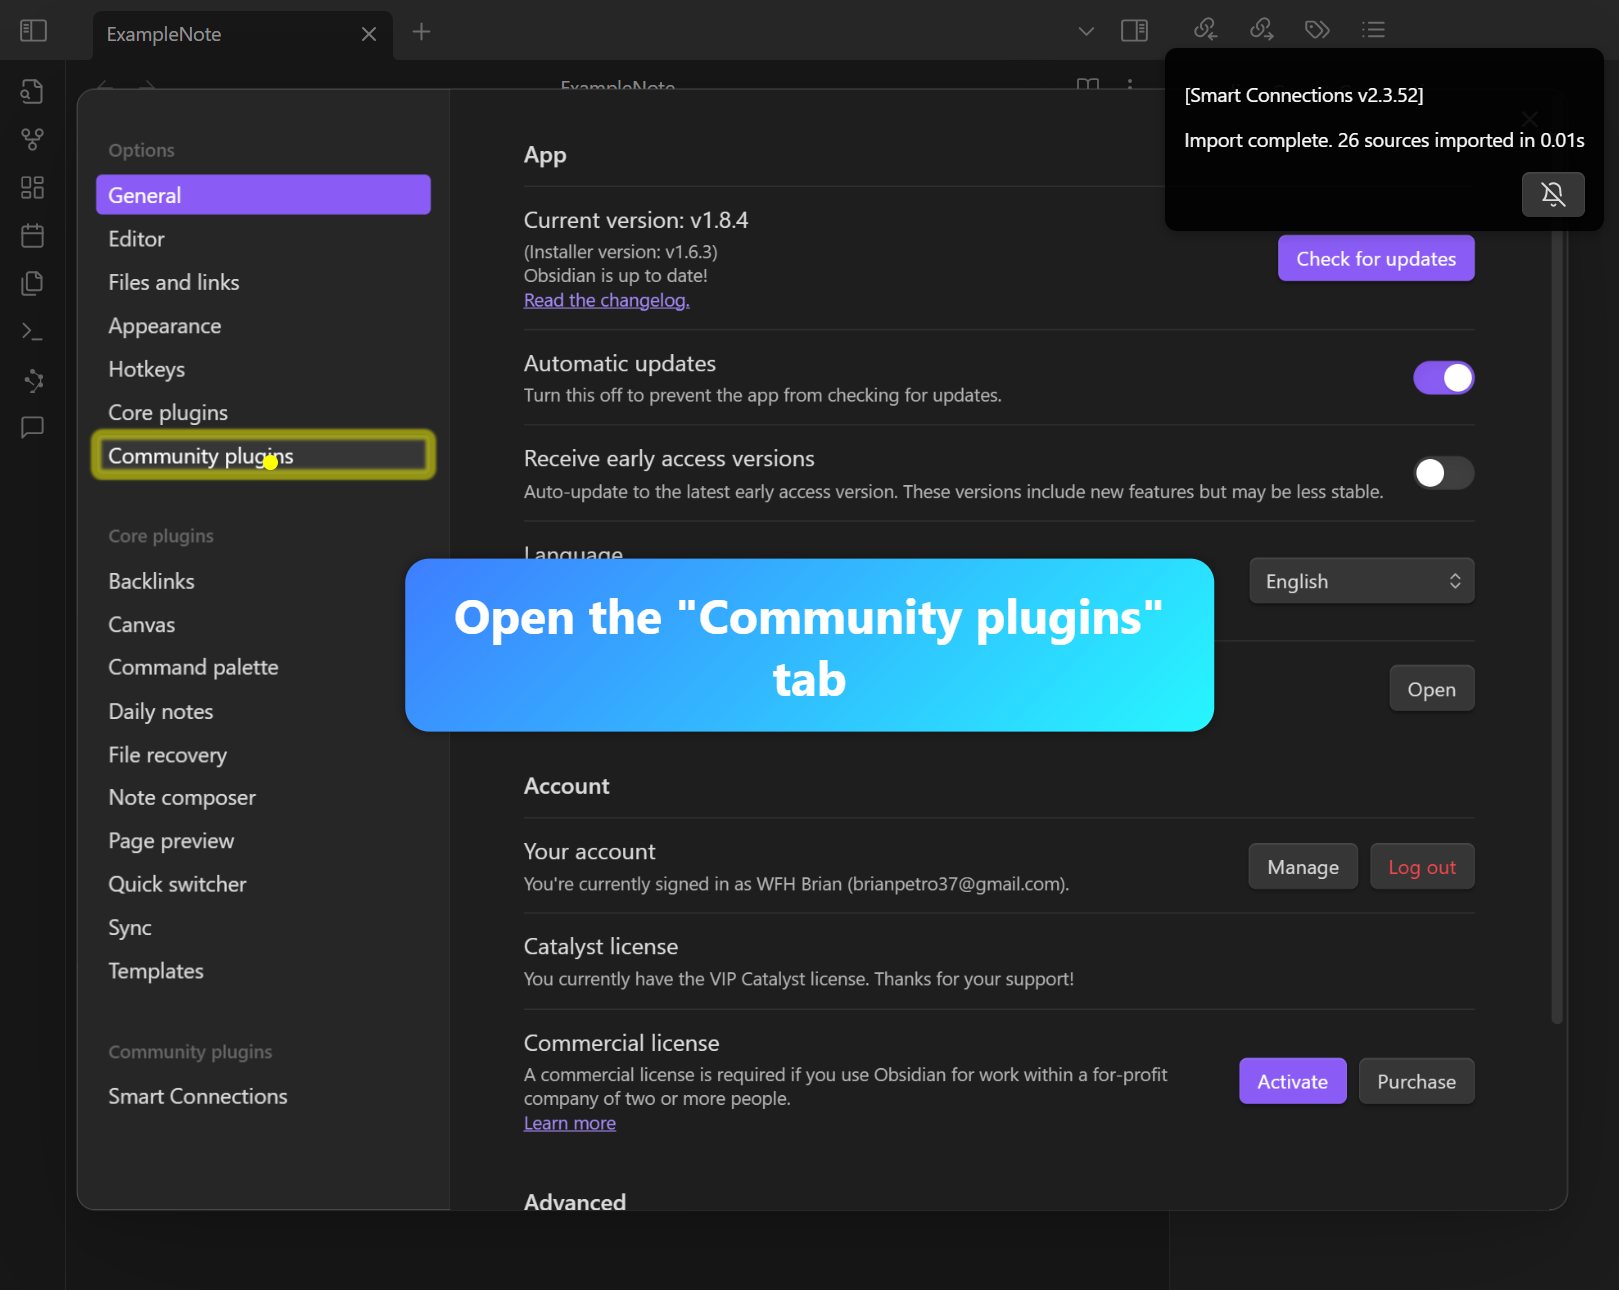
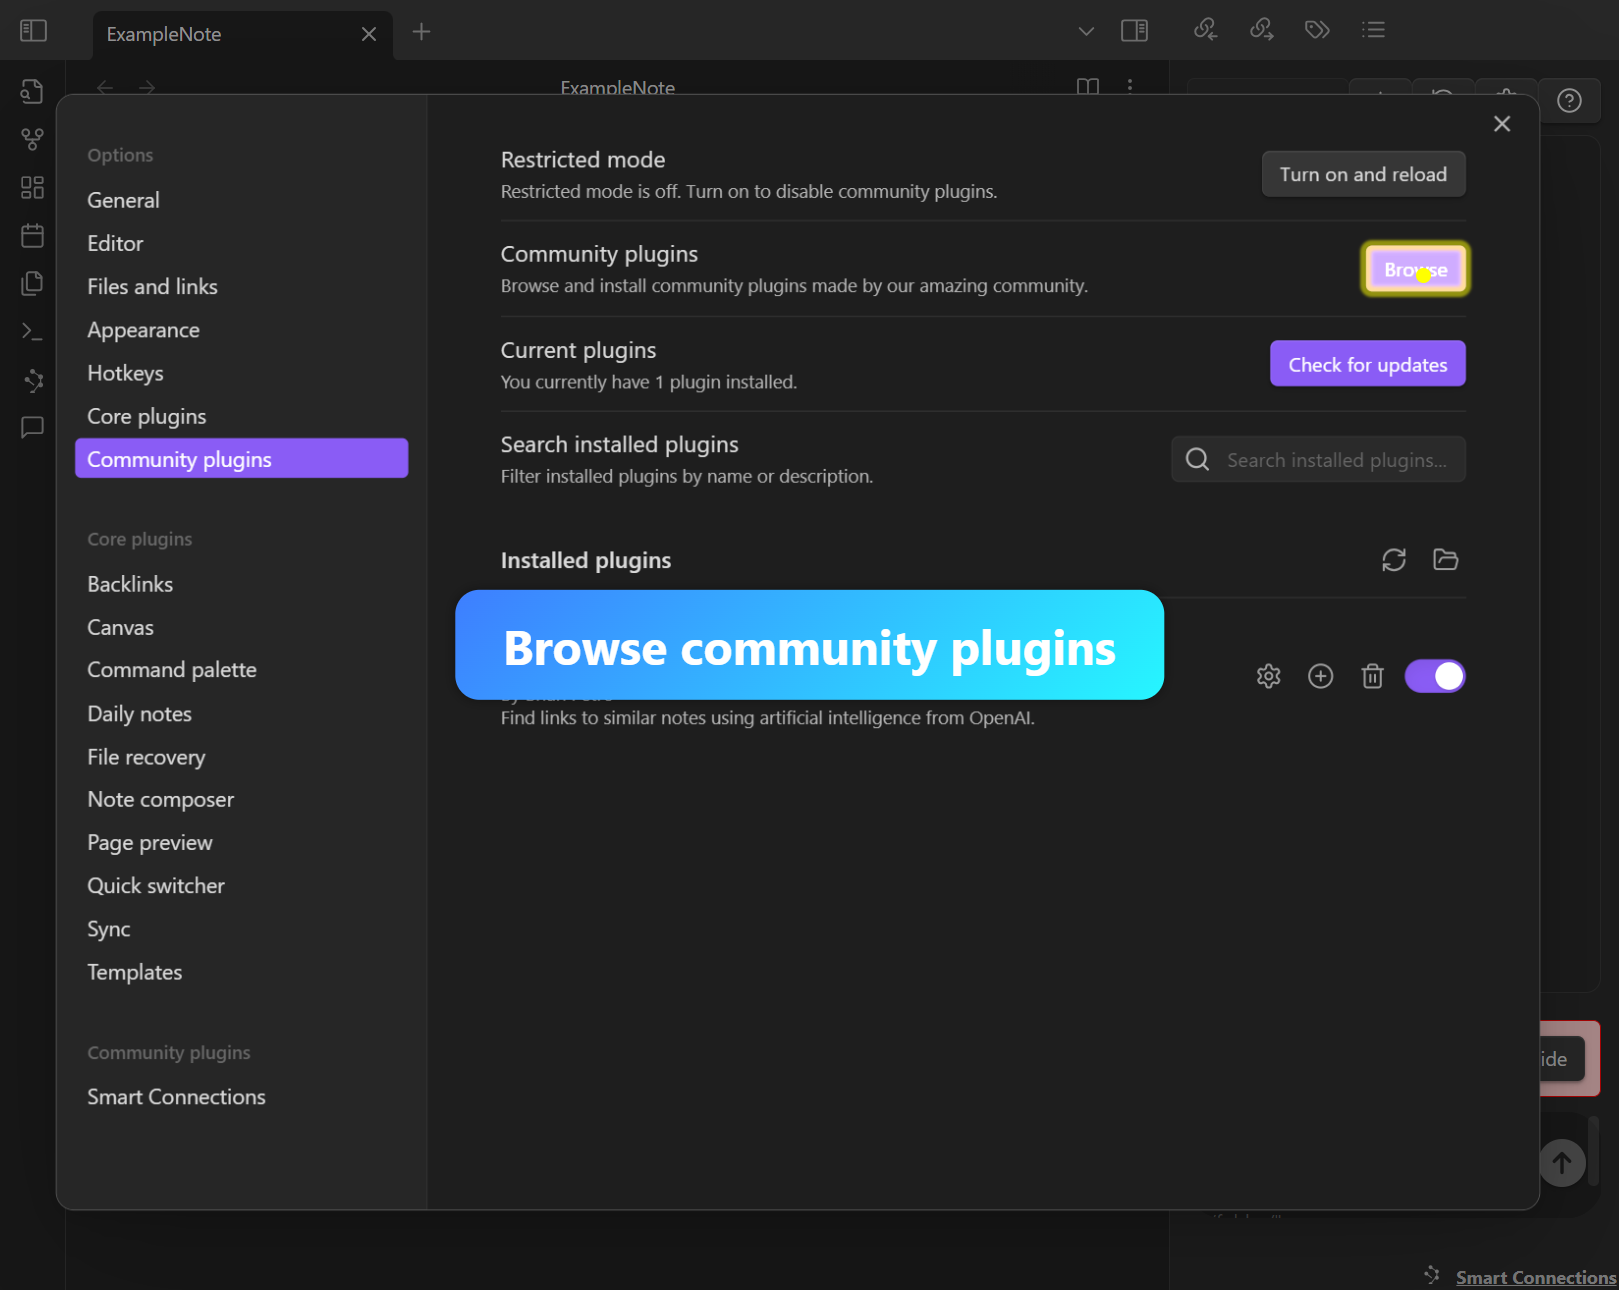
Step 2: Community Plugins → Search
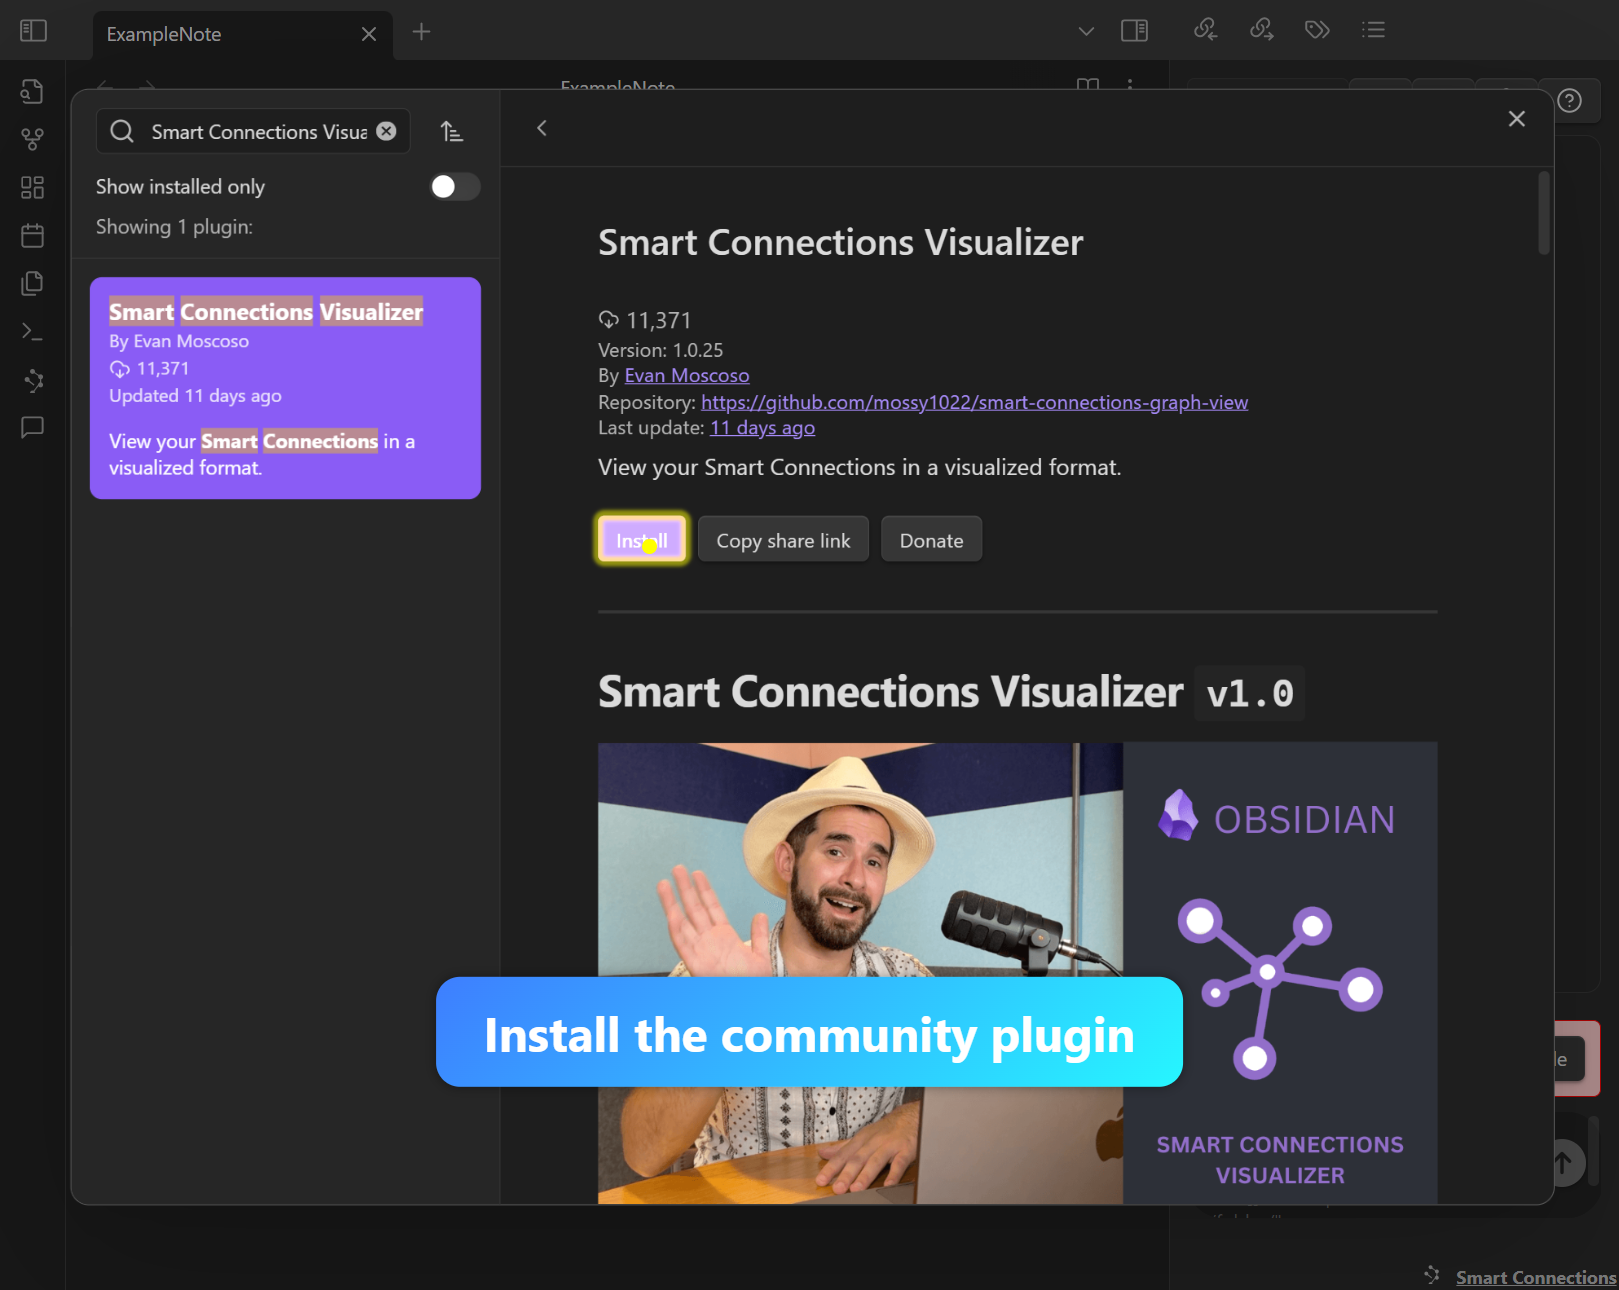
Go to ‘Settings’ → ‘Community Plugins’ and search for “Smart Connections Visualizer.”
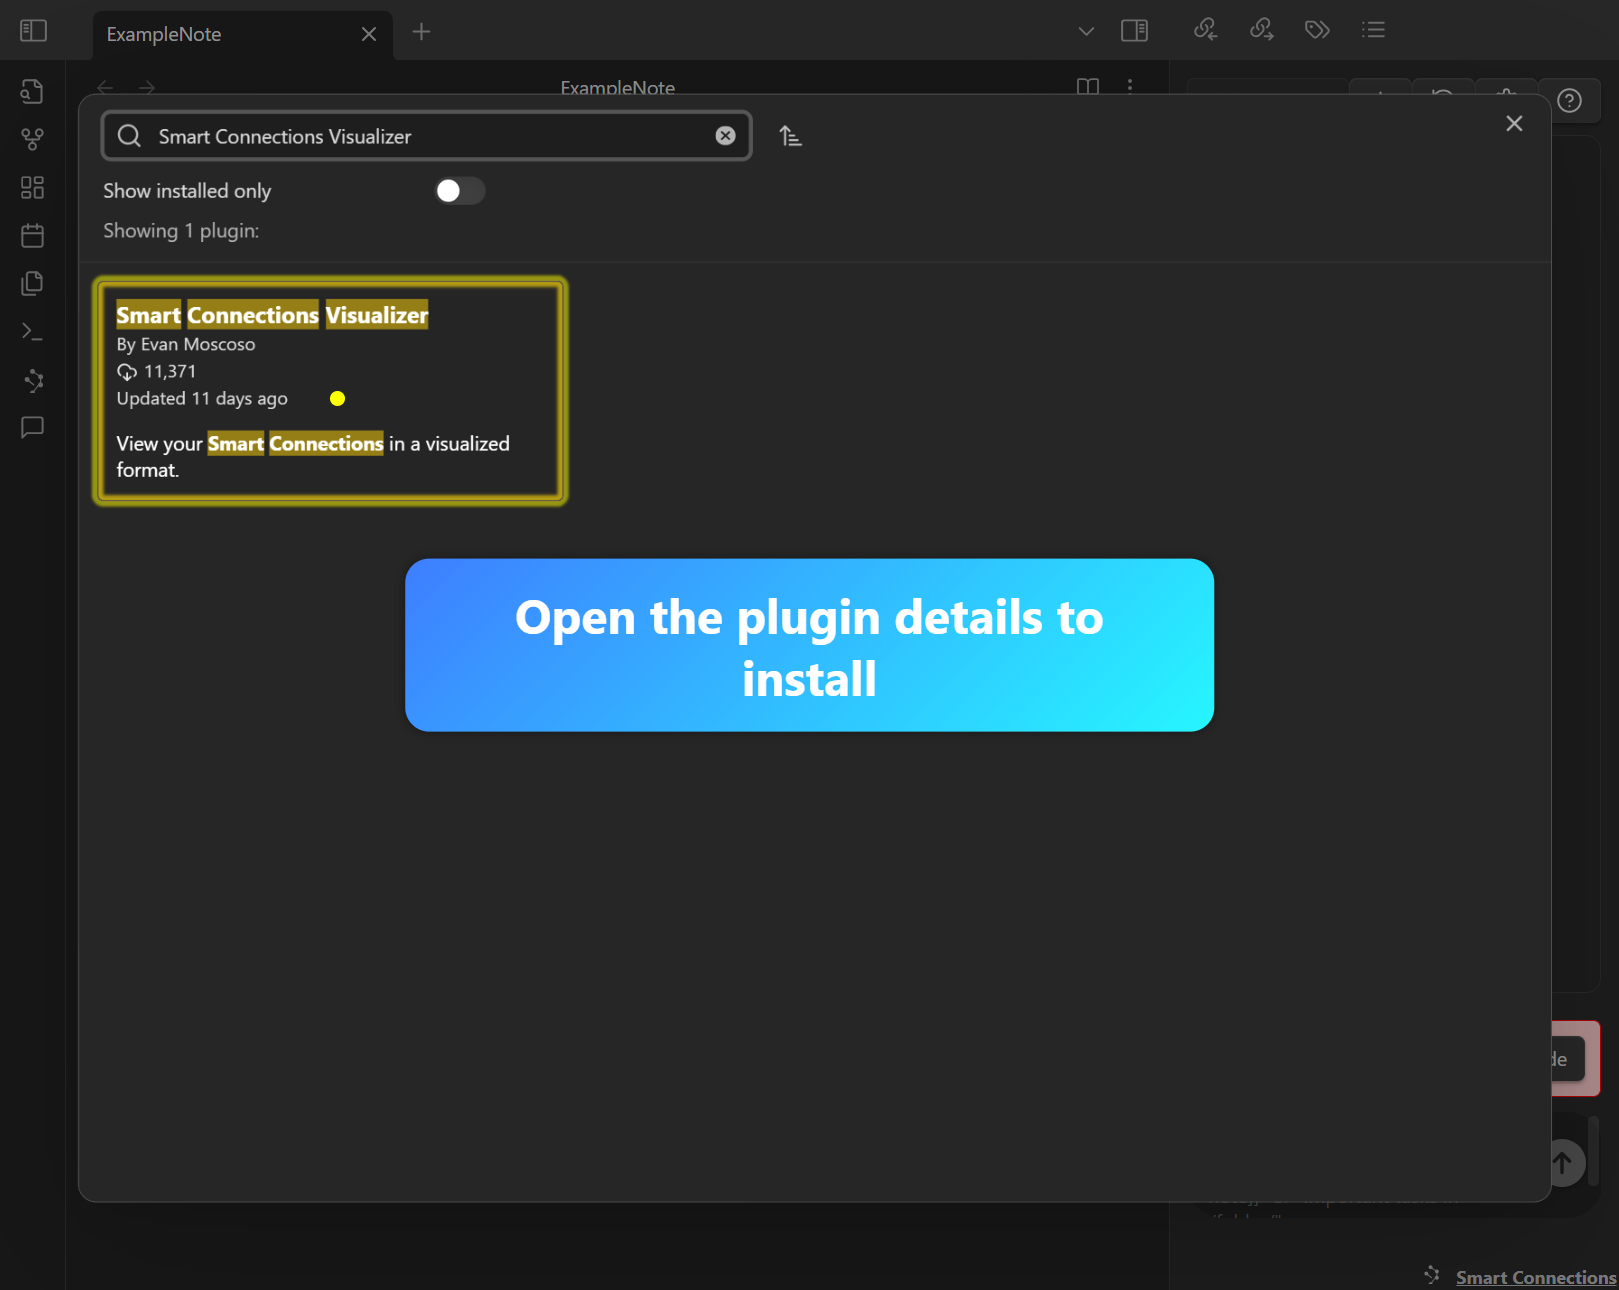
Step 3: Install and Enable
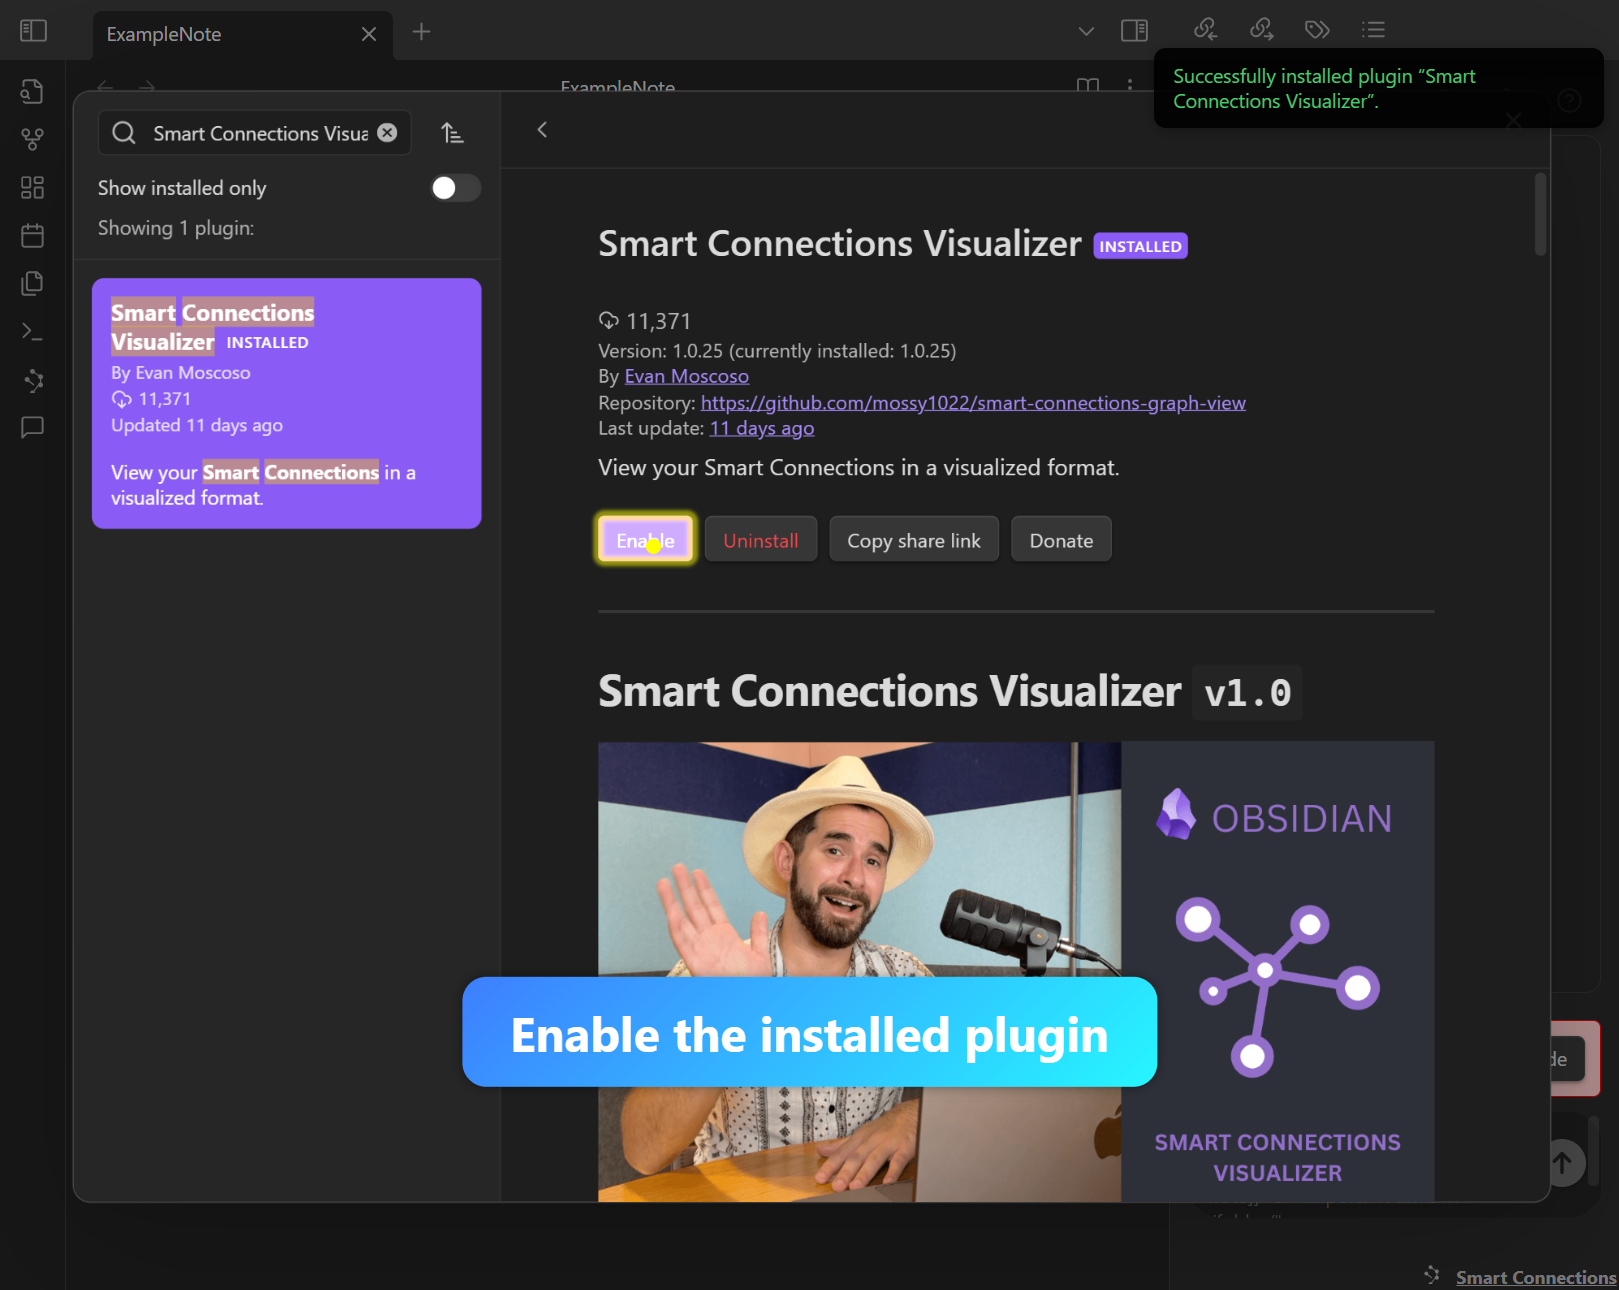
Install the plugin and click ‘Enable’ to activate it.
Step 4: Look for the Ribbon Icon
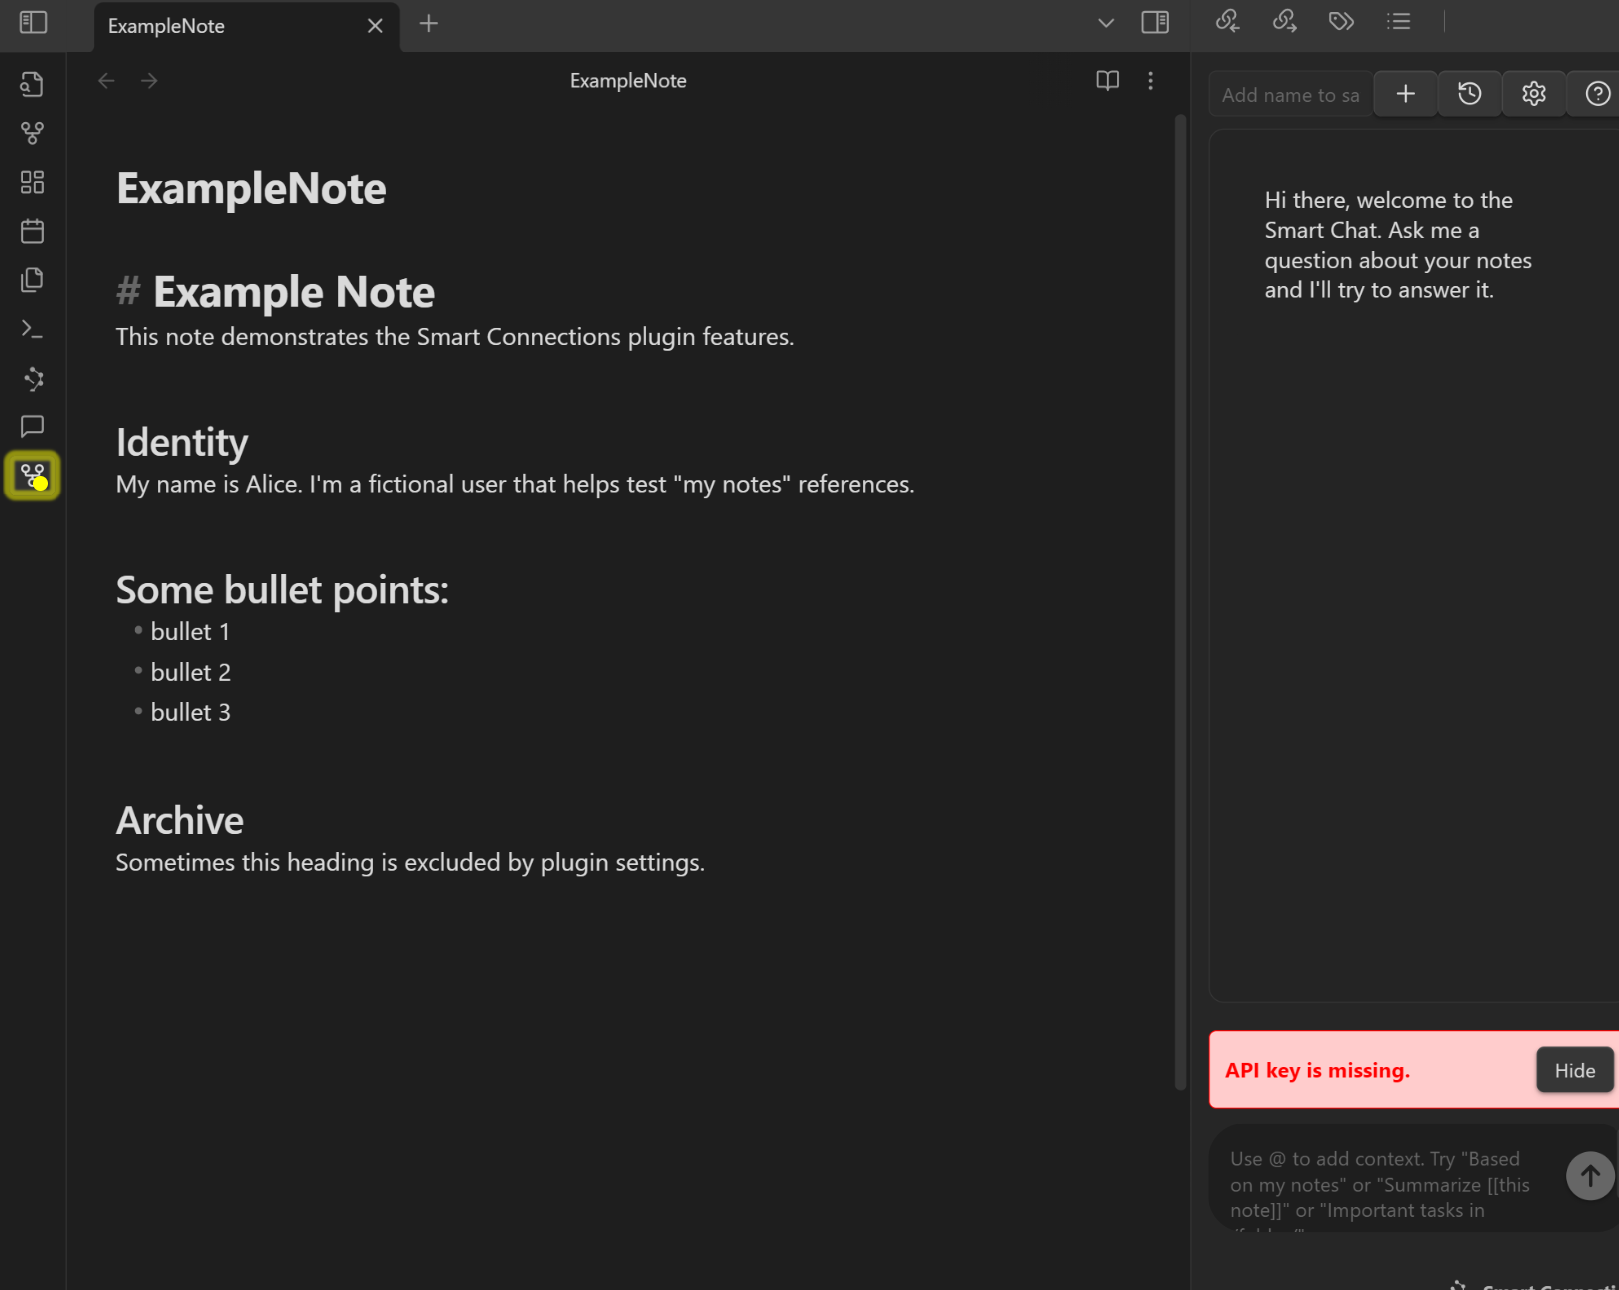
After enabling, a new ribbon icon (‘Open smart connections visualizer’) should appear in your Obsidian side panel.

Step 5: Open the Visualizer
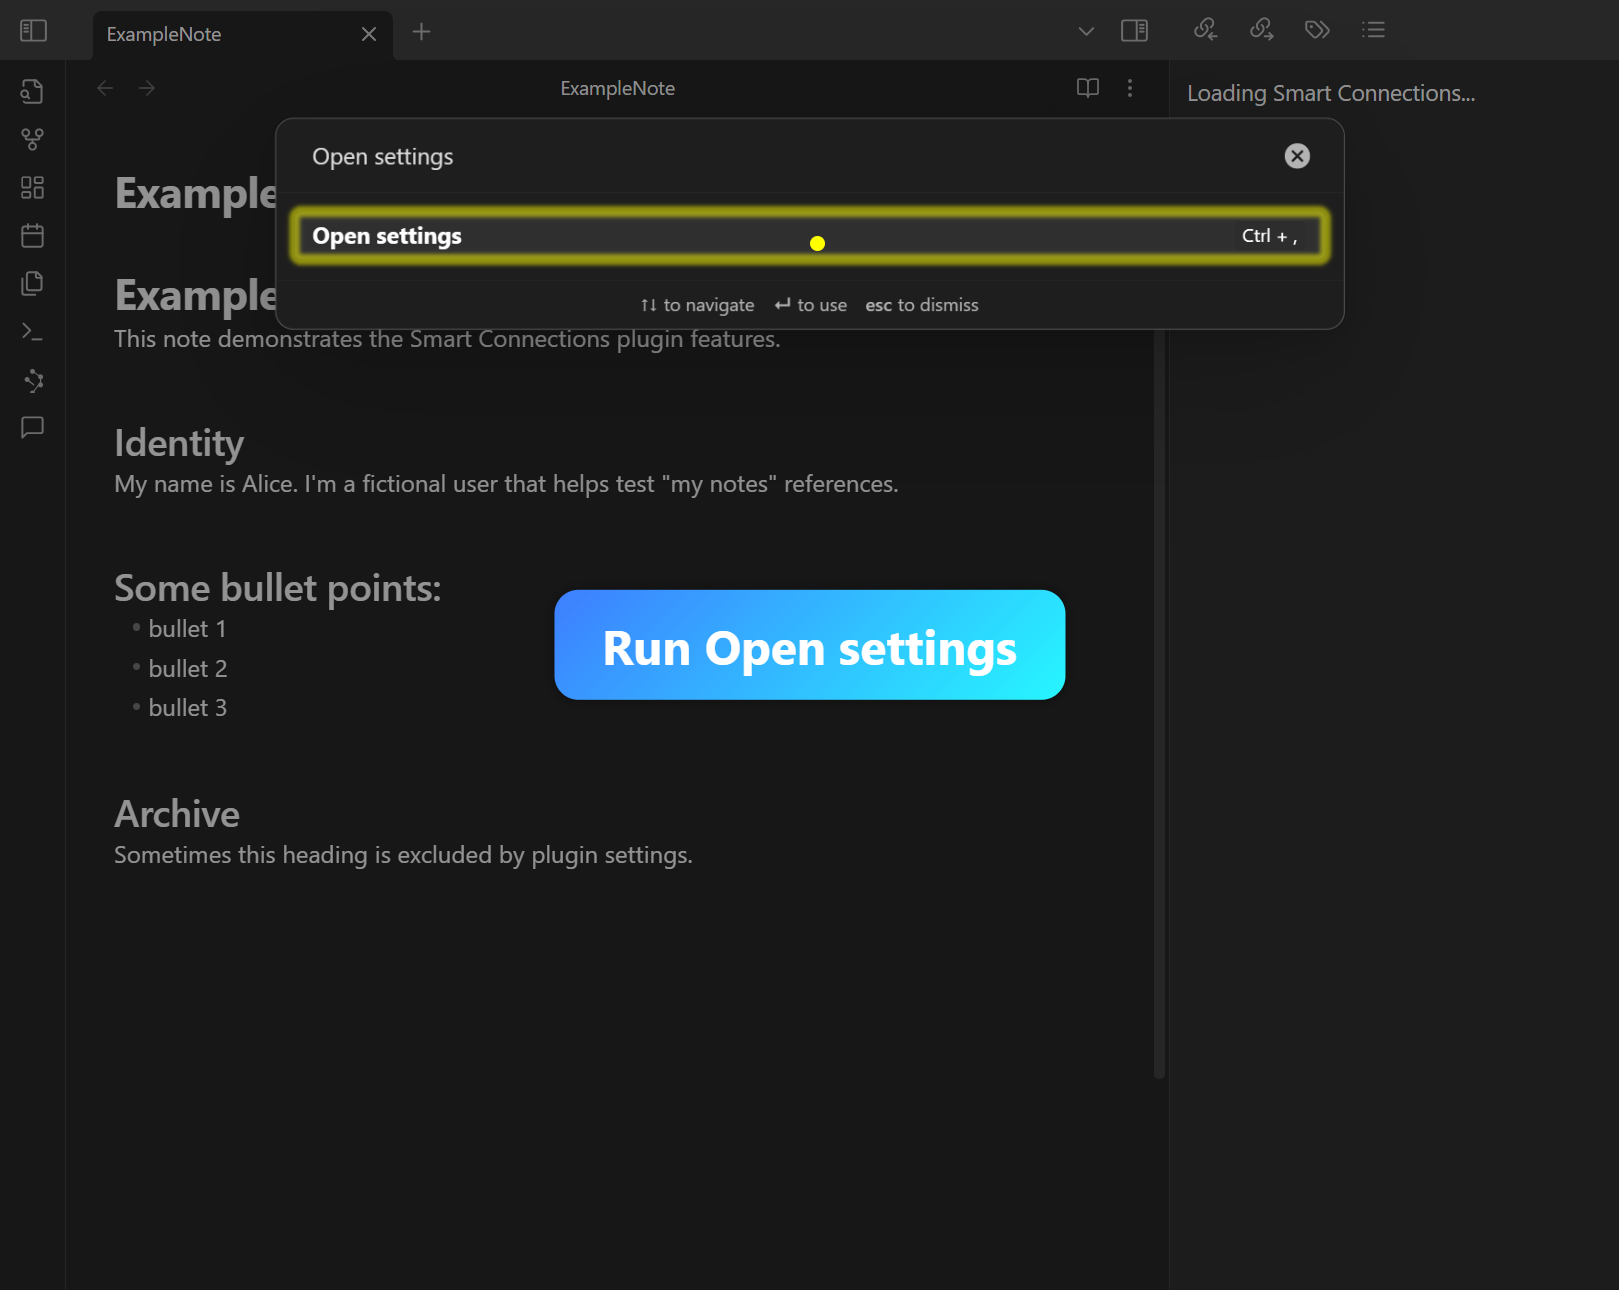
Click the ribbon icon or use the ‘Smart Connections Visualizer’ command from the Command Palette to open the visualizer pane.
Step 6: Confirm the Graph Renders
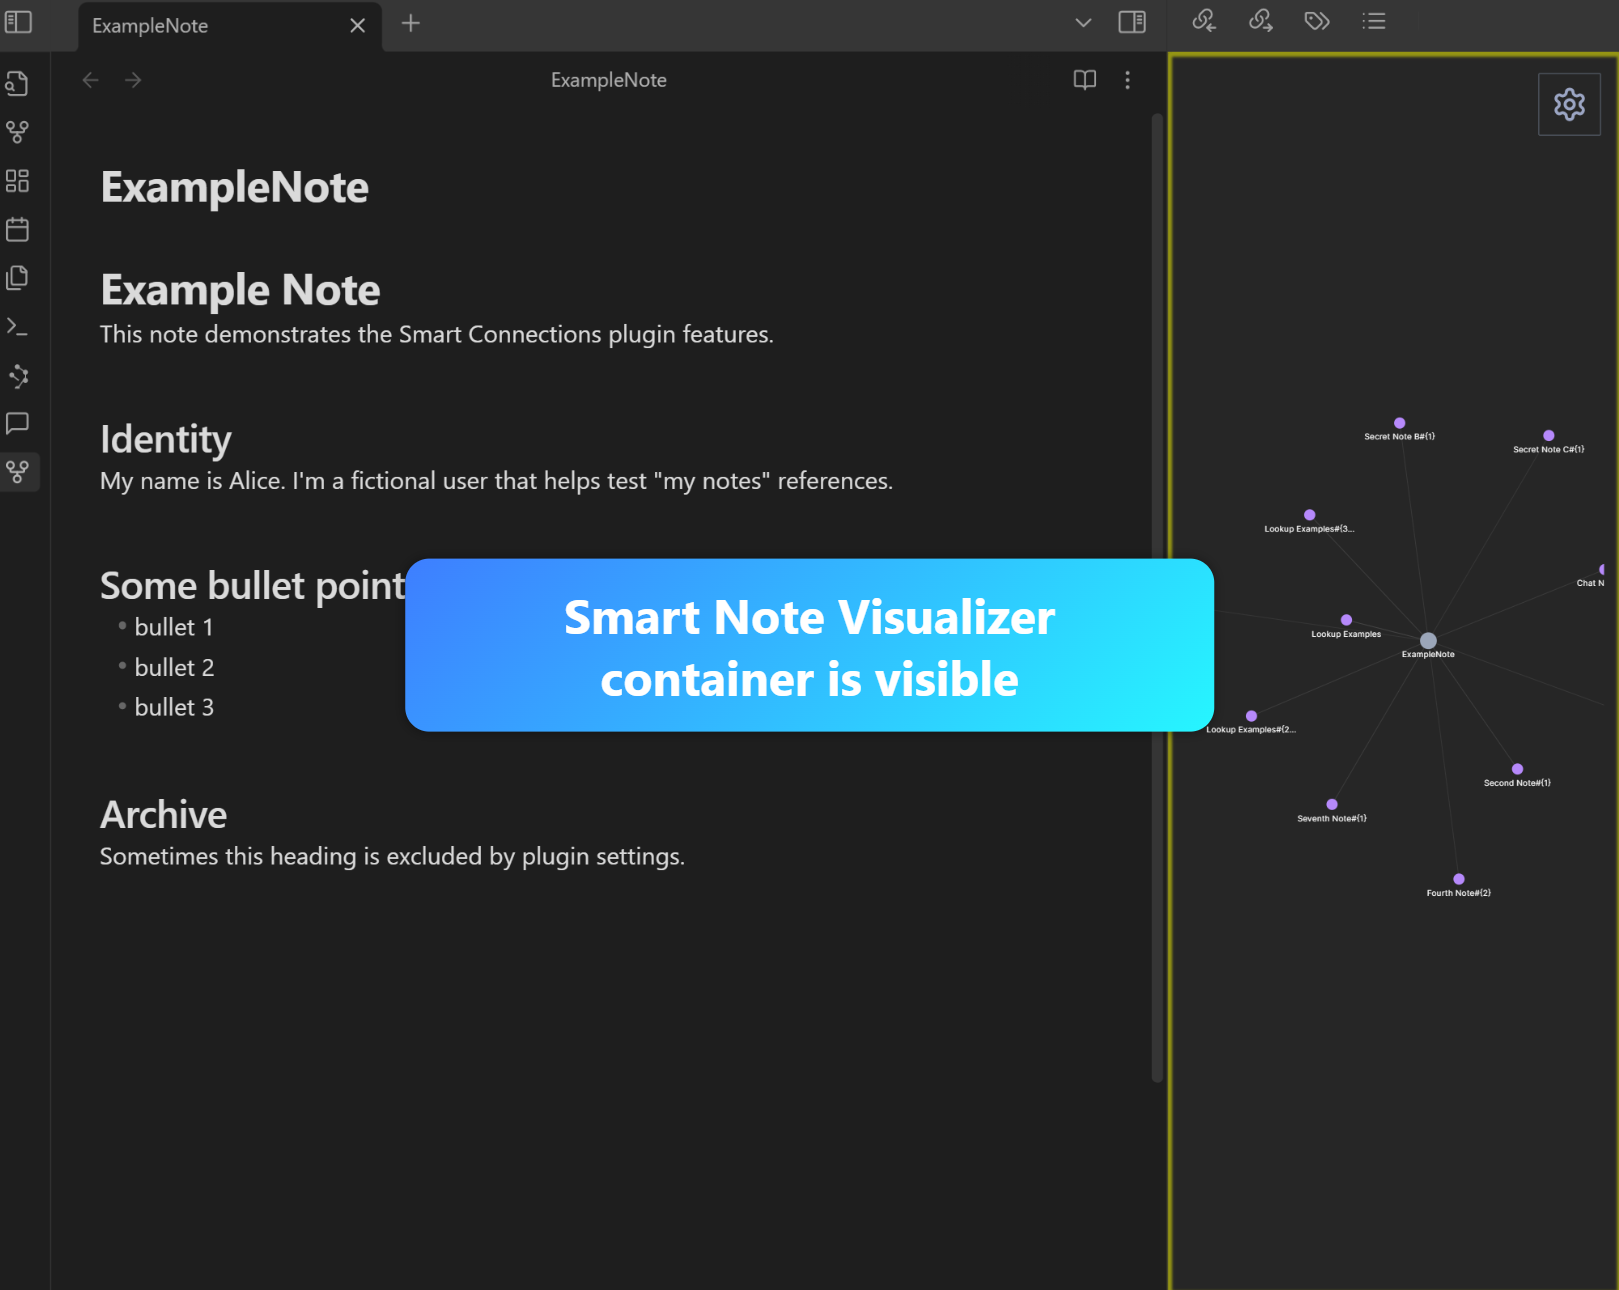
Once the visualizer pane is open, you’ll see an interactive graph representing your notes.
Demo 2: Interacting with the Graph
Step 1: Hover or Click a Node
Move your cursor over a node to see the note title. Clicking a node focuses that note or opens it in the main editor (depending on your settings).
Step 2: Zoom and Pan
Use your mouse scroll or trackpad pinch gestures to zoom, and click-drag the background to pan around large vaults.
Step 3: Open a Note from the Graph
When you click on a node, the note opens in Obsidian. Confirm that the correct note is visible.
Expected Results
- The ‘Smart Connections Visualizer’ appears under Community Plugins and installs successfully.
- A new ribbon icon or command palette entry is available to open the visualizer pane.
- Nodes are displayed in an interactive graph, which you can zoom, pan, hover, and click.
- Clicking a node opens the corresponding note in the main editor.